By John Egan
They’re truly raising the roofs in the Austin, TX, metro area.
A WikiLawn analysis of new data from the U.S. Census Bureau shows that among the country’s 50 biggest metros, the Austin area boasts the largest share of homes (nearly 3.3 percent) built in 2014 or later.
No other major metro surpassed the 3 percent mark for new housing units, such as houses, apartments and condos. Nationwide, 0.9 percent of all housing units were considered new as of 2017, the Census Bureau data indicates.
Rounding out the top five were:
2. Raleigh, NC (a little over 2.4 percent).
3. Houston, TX (a little over 2.2 percent).
4. San Antonio, TX (nearly 2.2 percent).
5. Nashville, TN, (nearly 2.1 percent).
The full list appears below.
The newly released Census Bureau data, gathered through the American Community Survey, gives estimates of a host of housing, economic and demographic milestones in the U.S. through 2017. Among them is the number of housing units constructed from 2014 to 2017 in every U.S. metro.
Of the 14 major metro areas with the most new homes, our analysis finds that four of them are in Texas — Austin, Dallas-Fort Worth, Houston and San Antonio. Two metros in Florida appear in our tally (Jacksonville and Orlando), as do two in North Carolina (Charlotte and Raleigh).
Not surprisingly, all of the metros on our new-housing list have experienced significant surges in population in recent years. After all, a bump in population ordinarily prompts a need for more places to live.
Among the 10 U.S. metros with the fastest-growing population (on a percentage basis) from 2016 to 2017, only Austin also shows up in our new-home ranking. In just one year, the Austin area’s population climbed 2.7 percent, Census Bureau data shows.
Examined another way, though, five of the 14 metros on our list also are among the country’s fastest-growing.
From 2016 to 2017 alone, Dallas-Fort Worth led all U.S. metro areas for the raw number of residents added (146,238), according to the Census Bureau. Houston was No. 2, adding 94,417 residents; Seattle, WA, was No. 6, with 64,386 new residents; Orlando was No. 8, with 56,498; and Austin was No. 9, with 55,269.
While areas like the ones in our ranking are putting up new housing units at a fairly speedy clip, that’s not enough to meet overall demand. According to new research from mortgage lender Freddie Mac, the annual rate of housing construction across the U.S. currently is about 370,000 units shy of the level required to satisfy housing needs — especially the rising demand for affordable homes and apartments — over the long term.
Aggravating the housing supply-and-demand imbalance is an escalating shortage of laborers and subcontractors for construction of single-family homes.
While Austin sits at No. 1 in our ranking for the heftiest share of new homes, the Austin Strategic Housing Blueprint estimated that at least 135,000 more housing units would need to be built just in the city — not the entire metro area — from 2015 through 2025 to accommodate even more residents. The Austin City Council adopted the blueprint in 2017.
“The biggest problem with housing is that there’s just not enough of it to go around,” Austin Mayor Steve Adler said in 2017. “I’m here to tell you that the law of supply and demand, and its relationship to prices, applies even in Austin. We simply don’t have enough housing supply now to keep up with demand. And by not creating enough housing in Austin, we’re pushing people out of town to cheaper housing in surrounding communities, adding to their commute, our congestion and everyone’s expenses.”
Making matters worse: The population boom in Austin and the surrounding suburbs isn’t cooling off anytime soon. If current projections are accurate, the Austin metro area will have welcomed more than 190,000 residents from 2017 to 2020.
“Due to rapid population growth throughout Central Texas, Austin continues to have one of the highest demands for housing in the nation,” Brandy Guthrie, 2017 president of the Austin Board of Realtors, said in December 2017.
Led by Austin, here’s our list of the 14 Metro Areas With the Most New Homes (as a percentage of all housing units).
1. Austin, TX

Total housing units: 786,584
Housing units built in 2014 or later: 25,850
% of housing units built in 2014 or later: 3.29%
2. Raleigh, NC

Total housing units: 511,414
Housing units built in 2014 or later: 12,435
% of housing units built in 2014 or later: 2.43%
3. Houston, TX

Total housing units: 2,499,292
Housing units built in 2014 or later: 55,934
% of housing built in 2014 or later: 2.24%
4. San Antonio, TX

Total housing units: 874,247
Housing units built in 2014 or later: 19,141
% of housing units built in 2014 or later: 2.19%
5. Nashville, TN

Total housing units: 747,845
Housing units built in 2014 or later: 15,515
% of housing built in 2014 or later: 2.07%
6. Dallas-Fort Worth, TX

Total housing units: 2,696,167
Housing units built in 2014 or later: 51,922
% of housing built in 2014 or later: 1.93%
7. Orlando, FL

Total housing units: 995,591
Housing units built in 2014 or later: 17,989
% of housing built in 2014 or later: 1.81%
8. Oklahoma City, OK
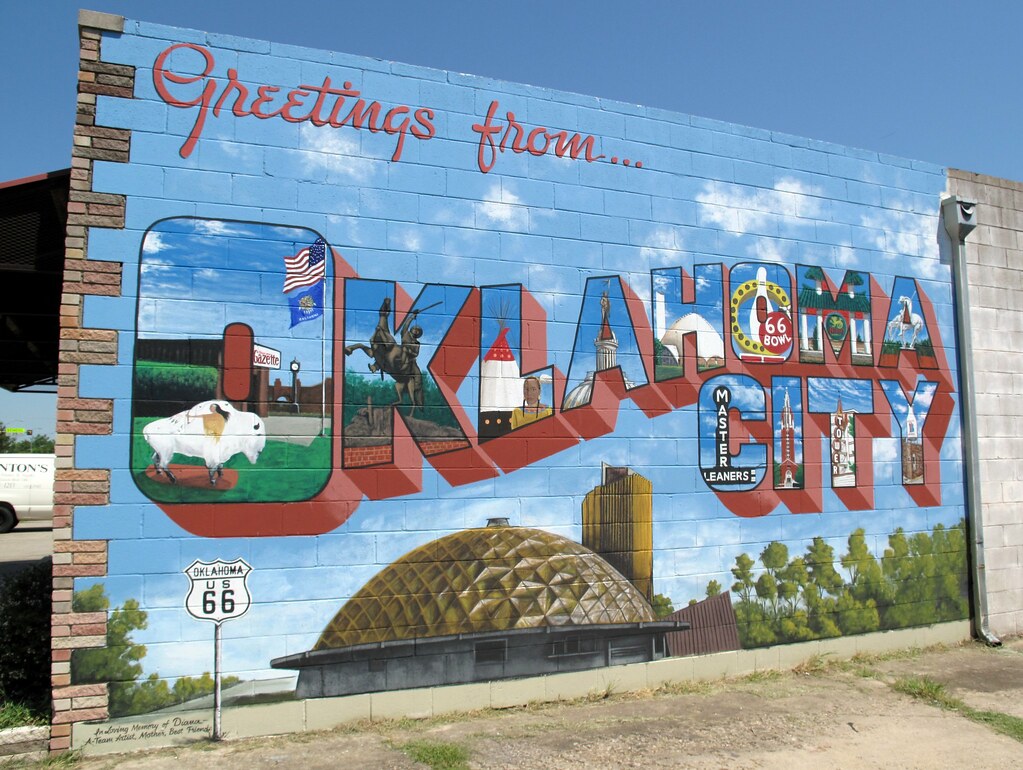
Total housing units: 563,445
Housing units built in 2014 or later: 9,878
% of housing units built in 2014 or later: 1.75%
9. Jacksonville, FL

Total housing units: 625,888
Housing units built in 2014 or later: 10,709
% of housing units built in 2014 or later: 1.71%
10. Denver, CO

Total housing units: 1,136,616
Housing units built in 2014 or later: 18,588
% of housing units built in 2014 or later: 1.64%
11. Charlotte, NC

Total housing units: 993,111
Housing units built in 2014 or later: 16,061
% of housing units built in 2014 or later: 1.62%
12. Salt Lake City, UT

Total housing units: 405,112
Housing units built in 2014 or later: 6,057
% of housing built in 2014 or later: 1.50%
13. Seattle, WA

Total housing units: 1,544,134
Housing units built in 2014 or later: 22,148
% of housing units built in 2014 or later: 1.43%
14. Portland, OR

Total housing units: 966,346
Housing units built in 2014 or later: 12,245
% of housing units built in 2014 or later: 1.27%
Author Bio: John Egan is a freelance writer who covers everything from personal finance to lawn care. His masterful work has been featured in The Huffington Post, Forbes, and The Guardian.
